Simple Web Service Monitoring and Status Page
One of my favorite questions to ask developers and team leads during interviews is, “Is the service you’re working on currently available?”
I believe that every experienced developer should think not only about development but also about service operation. It is much easier to start collecting metrics during development than to later try to find something to use for monitoring and alerting.
And yet, often we work with existing products, and their previous developers may not have left any monitoring behind.
The easiest way to know if your web service is available
One of the simplest methods (in the case of a web service accessible via http) is to use any service that “pings” your service from outside at a certain interval.
The obvious advantages of this approach are:
- No need to change anything in the code;
- It can be set up in minutes;
- There are hundreds of companies that provide such services for a small fee;
- You can set up “pinging” from different locations if it is important to you;
- You can set up notifications for prompt response.
Because of its simplicity and maximum usefulness (if your service is unavailable, then it is probably a disaster), this approach has won the love of many DevOps engineers. And, to be honest, I still wonder why this is not used in all companies that develop something and where this approach can be applied.
Along with the “pinging” functionality itself, there is usually a status page that shows what is currently happening with your service. This is a very customer-oriented approach, where you can honestly show when your service was available.
What options are available?
Recently, I have divided services into two categories:
- SaaS;
- Open source (self-hosted).
In the case of SaaS, there is no need to deal with infrastructure at all, just choose a suitable service based on your criteria, a tariff (there are also many free options), and go ahead.
In the case of open source, you can get an equally high-quality product, but one that is fully under your control. The important point here is that the utility must be installed on a different server/cluster than the product being checked. Because I experiment a lot, this is my option, as the hardware has already been paid for.
I will give 3 examples of such services. In reality, there are many of them, and they are easily searchable.
SaaS - Cloud-based options:
- Better Uptime;
- UptimeRobot;
- StatusCake.
Open source (self-hosted):
- Upptime;
- Uptime Kuma;
- Zabbix.
I will stop a little more on self-hosted.
Upptime
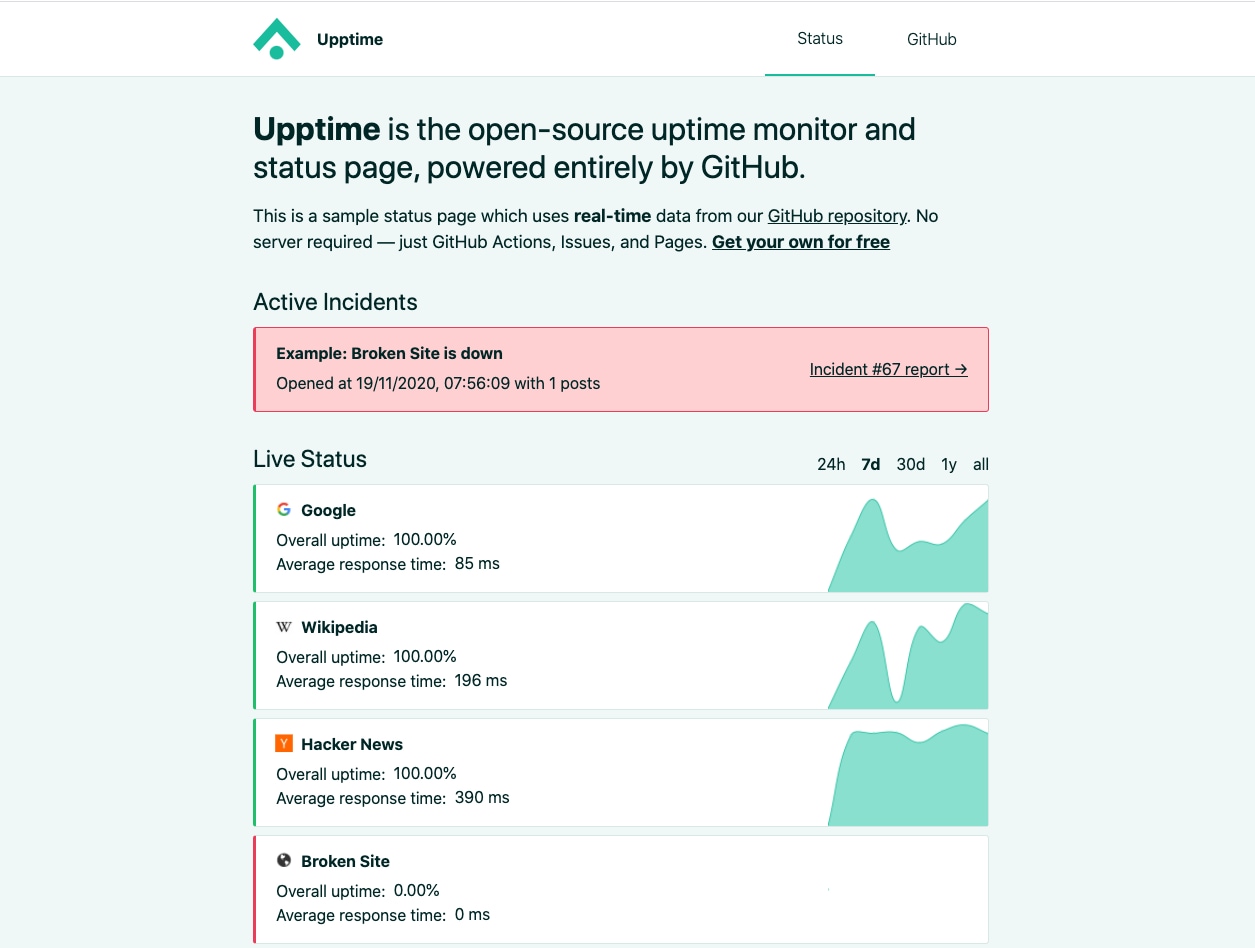
This service can be deployed on Github’s infrastructure absolutely for free. A Github-Action will be created every 5 minutes to check the availability of your services.
Uptime Kuma
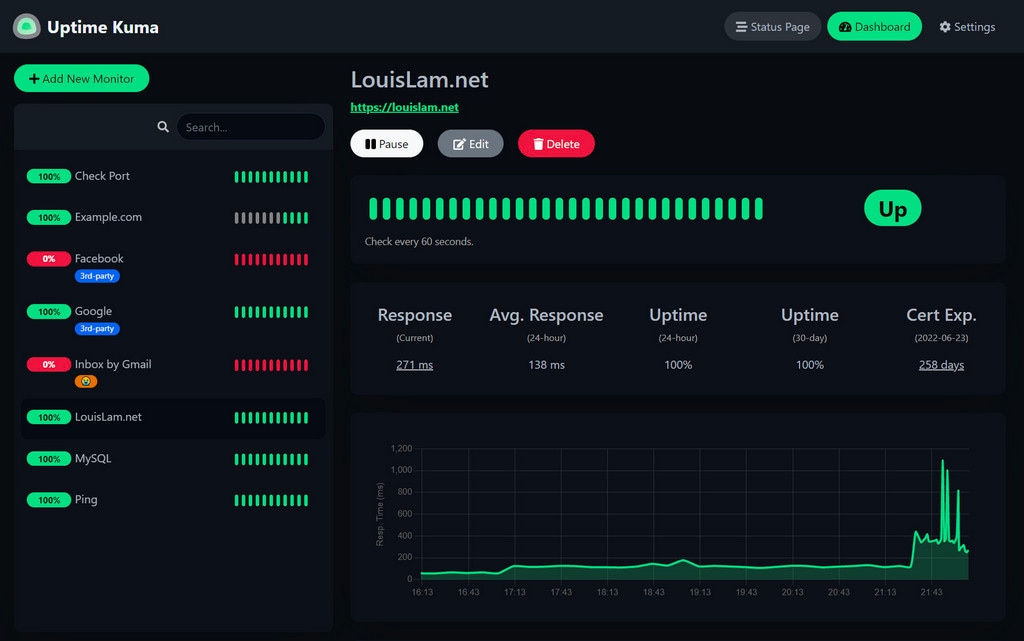
Uptime Kuma is written in JS and can be deployed on your VPS.
I chose it for myself because:
- you can ping services every 30 seconds (or more frequently);
- you can configure notifications (including Telegram) for service unavailability;
- you can create separate status pages (here is an example - Econumo status page);
- the admin interface is very convenient and simple.
Here is your docker-compose.yml:
version: '3.3'

services:
  uptime-kuma:
    image: louislam/uptime-kuma:1
    container_name: uptime-kuma
    volumes:
      - ./uptime-kuma-data:/app/data
    ports:
      - 8080:3001  # <Host Port>:<Container Port>
    restart: always
Zabbix
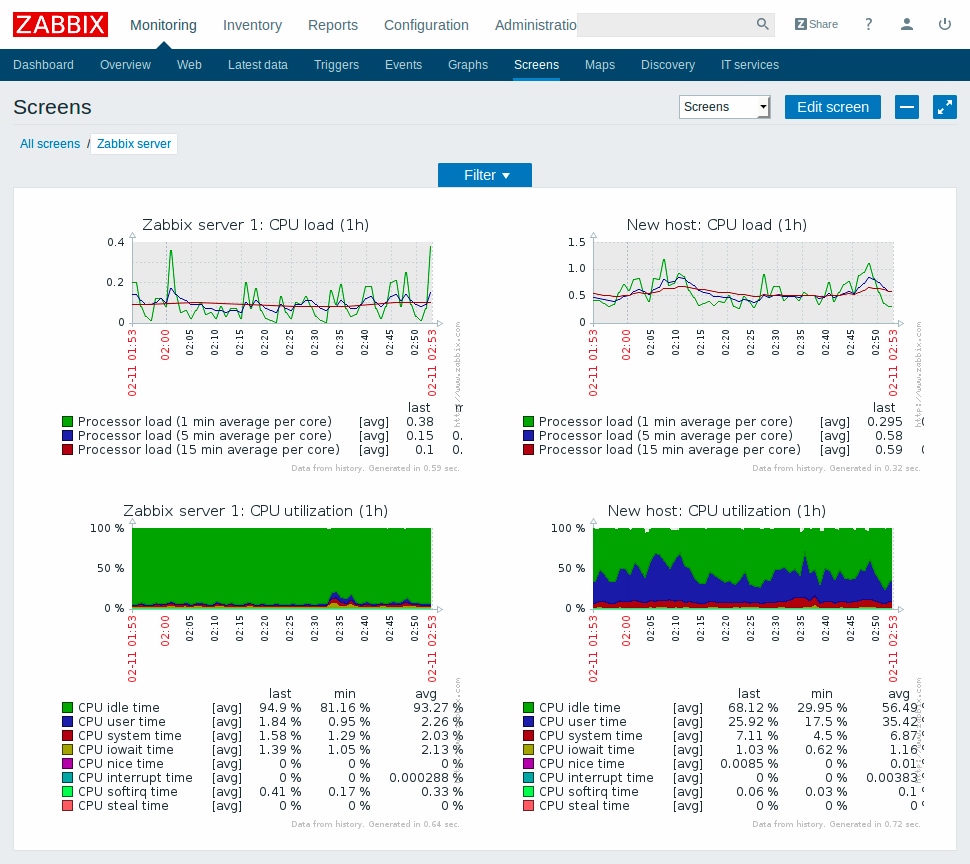
The heavyweight of my selection. There are thousands of pages of documentation on Zabbix in any language. This utility is actively used by Unix system administrators. Zabbix allows you to monitor anything, but unfortunately requires deep configuration. You can use both cloud and on-premise versions.
In conclusion
Dear developers, please, when developing a new product, think immediately about how it will be monitored. You can and should start monitoring the uptime of your service right now.
Translated by ChatGPT